
In this article detail of Z –Score discussed keeping in view:
- Use of Z-score in general and
- Use of Z-score in proficiency Test (PT) as part of one of the requirement of ISO/IEC 17025
WHAT IS Z-SCORE?
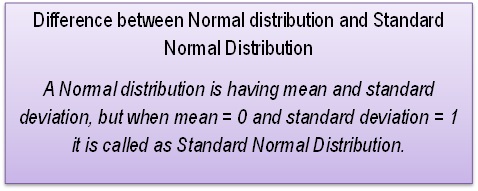
To understand Z –score first we understand difference between Normal distribution and Standard Normal Distribution.
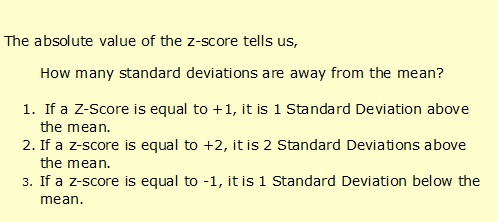
Z-score is also known as standard score and it measures how many standard deviations is a Z-score from mean. More specifically, it measures how many standard deviations above or below a population mean is.
FORMULA FOR Z-Score CALCULATION:
So, we will start with,
- Use of Z-score in general
The importance of z-score can be seen from the point of view of probability and comparing the two score, can be summarized as below:
(a) The probability of a score occurring within normal distribution and
(b) Comparing two scores that are from different normal distributions.
EXAMPLE:
A student, Vartika got 475 marks in exam and mean of all marks of students is 460 and standard deviation is 20. We have an assumption that exam marks found to be normally distributed. Total no of students appeared for exam is 25.
We can see that, Vartika’ s mark is more than mean by 15 (= 475-460).
Now we have to see, how well Vartika perform as compare to other 25 students?
For this we will use Z-score.
Z scores are used to assist evaluation of performance, here in this case performance of students.
Z score is based on the distribution of results around the mean.
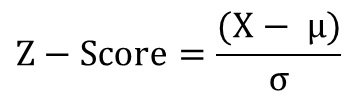
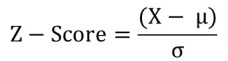
Formula for Z – Score is as below:
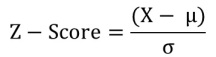
Here,
X = the score, µ = Mean and σ = Standard Deviation
To simplify, we will arrange our numbers in tabulated format as below,
| Exam | Score (X) | µ ( Mean) | σ ( Standard Deviation) |
| Marks | 475 | 460 | 20 |
So,
Z score = (475-460)/20
Z score = 15/20
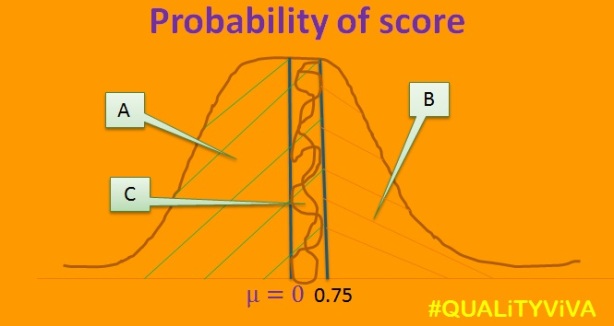
Z score = 0.75
So, in our example z-score = 0.75, i.e. 0.75 standard deviation above mean.
To check how well “Vartika” performs, is nothing but to calculate, percentage of marks higher than and lower than marks of “Vartika” other students got..
Again in other words, this is nothing but to calculate probability of score greater than and less than marks of students.
The probability of a score can be found out when frequency distribution is normally distributed. In this case standard normal distribution convert the data in frequency distribution with mean is 0 and standard deviation is 1.
To calculate probability, we have to take help of standard normal distribution table or excel.
A.Probability of score lower than “Vartika”
NORMSDIST (z) = NORMSDIST(0.75) = 0.7734
That is, 77.34 % of students having marks lower than “Vartika”
This can be found using Cumulative Standard Normal Distribution Table
B.Probability of students having marks better than “Vartika”
= 100-77.34 = 22.66% i.e. 0.2266
This can be found using Standard Normal Distribution Table.
C.Probability of marks lower than “Vartika” but above mean
= 0.50 – 0.2266 = 0.2734 i.e. 27.34 %
NOTE: The above is the case, when values more than mean is better.
Z score is more useful when we want to calculate, at what minimum marks student came in top 10 %.
As our mean is 460, we can conclude that marks will be more than mean.
Marks above 10 % is 100-10 = 90 or 1-0.1 = 0.9
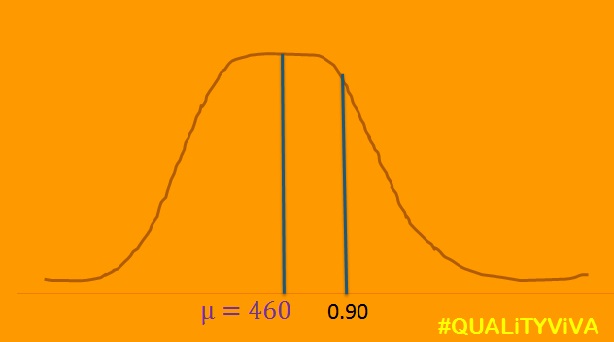
Calculate Z score with use of excel formula, =NORMSINV(0.9) =1.281552 =1.282
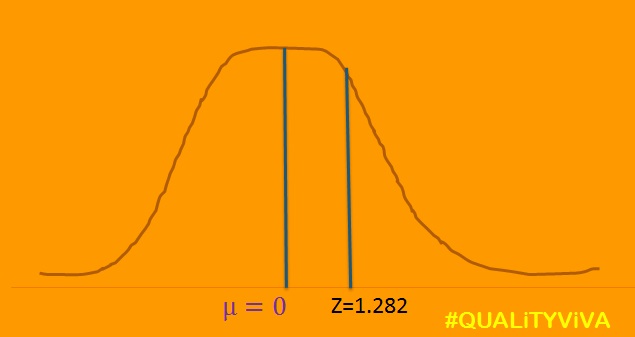
| Exam | Score (X) | µ ( Mean) | σ ( Standard Deviation) | Z-score |
| Marks | ? | 460 | 20 | 1.282 |
1.282= (X-460)/ 20
So, X = (1.282 * 20) +460 = 485.64
Here, student who score marks in exam more than 485.64 are in top 10 %.
- Use of Z-score in proficiency Test (PT) as part of one of the requirement of ISO/IEC 17025
For calculation of Z-score, same formula to be used as mentioned above.
EXAMPLE:
Keeping same value as in above example of marks obtained in exam, this will help to understand Z-Score.
NOTE: In this case, value closed to mean is better.
To understand this we will take example of mechanical testing of steel sample, where sample are tested to check Ultimate Tensile Strength (UTS) , Yield Strength (YS) and percentage elongation of steel.
To make this easy,
- We will only consider value of UTS.
- To understand difference between two examples (i.e. of score in exam and UTS value) all the numbers in both examples are kept as it is.
Let us considered that PT programme conducted by an agency and there are total 25 participants from different laboratory.
We have an assumption that test results of UTS found to be normally distributed. The mean value is 460Mpa and standard deviation is 20Mpa.One of the lab say “Lab VAS” having UTS value of 475 Mpa, we can find that “Lab VAS” having UTS more than mean (460Mpa) value by 15 Mpa (= 475-460).
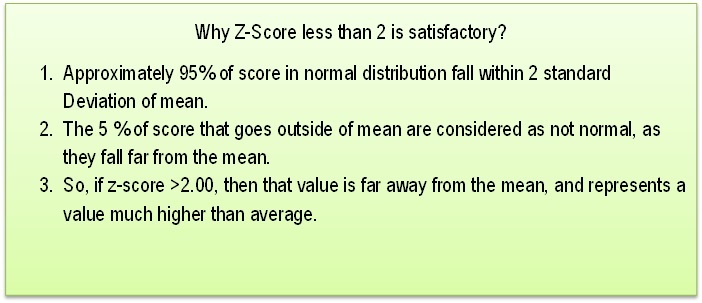
Here, in PT test Interpretation of Z- Score is carried out on below criteria,
|z-score| 2 — Satisfactory performance
2 < |z-score| < 3 — Questionable performance
|z-score| > 3 — Unsatisfactory performance
| Test | Score (X) | µ ( Mean) | σ ( Standard Deviation) |
| UTS | 475 | 460 | 20 |
For this example,
Z-Score = (475-460)/20 = 0.75
Z-Score = 0.75
The Z score of 0.75 of “Lab VAS” considered as satisfactory and no action required.
Next, if we want to compare two labs test results first is “Lab VAS” and another is “Lab AVS”.
| Test for “Lab AVS” | Score (X) | µ ( Mean) | σ ( Standard Deviation) |
| UTS, Mpa | 500 | 460 | 20 |
For this Z-Score = (505-460)/20 = 2.25
Z-Score = 2.25
The Z score of 2.25 of “Lab AVS” considered as questionable and required a closed look.
Besides Z-score, the other two evaluation criteria in PT are
- Percent difference, D
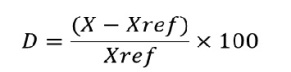
D= (X – Xref)/Xref X 100
X- is participating lab result
Xref- is assigned valu
2. En numbers
This is use in measurement of comparison scheme.
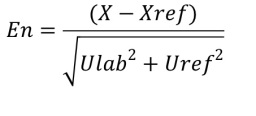
Here,
X- is participating lab result
Xref – is assigned value
Ulab – is uncertainity of participating lab result.
Uref – is uncertainity of reference laboratory’s assigned value.
En number evaluation criteria is as below,
|En| 1—- Satisfactory performance
|En| 1—- Unsatisfactory performance
Hope this article may useful to understand Z-score.

I really like your website, it has engaging content, Thank you!
LikeLike
very nice information Sir
LikeLike
Thank you very much.
LikeLike
Explained in a simple way, its good
LikeLike